 Summary (TL;DR) Predatory publishing is a significant issue in scientific discourse. Predatory publishers erode the integrity of science in the public eye due to accepting poor quality work or even misinformation advertised as professional investigation, and harm scientists that contribute time and money to aid these disreputable companies. Recent conversations around the Multidisciplinary Publishing Institute (MDPI) have accused MDPI of engaging in predatory practices. Notably, MDPI journals have been observed with high self-citation rates, which artificially inflate their Impact Factor compared to honest scientific discourse. Here I use a novel metric to assess whether MDPI journals have artificially inflated their Impact Factor: the ratio of Impact Factor (IF) to SCImago Journal Rank (SJR). This IF/SJR metric readily distinguishes reputable not-for-profit publishers from a known predatory publisher (Bentham Open), and also from MDPI. I further included a spectrum of for-profit and non-profit publishing companies in the analysis, including Frontiers, BMC, and PLoS. My results inform on the degree of predatory publishing by each of these groups, and indicate IF/SJR as a simple metric for assessing a publisher's citation behaviour. I suggest that an IF/SJR ratio >4 is an indication of possible predatory behaviour, and scientists approached by publishers with IF/SJR > 4 should proceed with caution. Importantly, the IF/SJR ratio can be determined easily and without relying on data hiding behind paywalls. Background The full dataset and R scripts used for the analysis are provided as a .zip file at the end of this article. Predatory publishing is a major issue in the scientific literature. Briefly: predatory publishers basically pose as legitimate scientific journals, but fail to perform the minimum rigour as curators of scientific information. Nowadays, outright fake journals are readily spotted by careful scientists, but quasi-predatory publishers can appear quite professional and are much more difficult to identify. Quasi-predatory publishers are identifiable by a few key factors (I have selected a few factors discussed in Ref [1]):
Regarding this fourth point, a journal's Impact Factor (IF) is an important metric that is used by granting agencies and scientists to judge a journal's prestige (for better or worse). The IF is determined by the average number of citations articles get when published in that journal. Importantly, the IF number can be artificially inflated by authors citing themselves or their close colleagues in a biased fashion [2]. On the surface, this gives the impression that the scientist or journal is highly productive and well-recognized. This gives predatory publishers a significant incentive to engage in self-citation practices that inflate their Impact Factor. Predatory publishers do this by citing work from their own network of journals in an unabashedly biased fashion [1]. I'll be referring to this as "Impact Factor Inflation" hereon (see [3]). Analyses like this one and studies like this one [1] have already discussed the quasi-predatory or even outright predatory behaviour of MDPI, which has grown more bold and problematic in recent years. The recommendation of Ref [1] was that scientific journal databases should remove MDPI due to predatory behaviour, indicating the degree of the issue being debated with MDPI. In particular, MDPI was seen to have significant self-citation issues, alongside 'citation cartels', networks of journals that cite each other to artificially inflate their impact factor [1]. I will add two more factors that are associated with predatory publishers:
For instance, the MDPI journal "Vaccines" recently published a vaccine misinformation piece that falsely claimed more people suffered serious complications from Covid vaccination than from Covid-19 disease (amongst a long history of other controversial pieces summarized here). However other publishers have also published controversial pieces that clearly lacked the rigour of professional peer review (e.g. see Frontiers Media here and Bentham Open here), and even highly-respected journals can slip up every now and then: remember that Science article about Arsenic being used as a DNA backbone? It is thus imperative to come up with ways to quantify the degree of predatory behaviour beyond anecdotes. IF/SJR: identifying Impact Factor inflation Here I have used a simple metric to quantify the degree of one particular predatory behaviour: the extent of Impact Factor inflation. To do this, I used the SCImago Journal Rank ("SJR", methodology here [4]) as an alternate metric that is known to better reflect journal impact by controlling for self-citation networks. Journals that are cited mostly by only a small network of journals have a lower SJR. This decouples the effect of total citations (Impact Factor, IF) from so called 'quality citations' by other authors publishing in diverse journals (reflected in the "SCImago Journal Rank" or SJR). The ratio of IF/SJR can therefore be a proxy to detect whether journal IF is being inflated beyond what it "more fairly" deserves, likely owing to self-citations or citation networks; this was recently noted for MDPI in Ref [1]. Importantly, this IF/SJR metric is approachable to the layman, as both input variables are publicly available information; unlike publisher statistics hiding behind paywalls. Thus, anyone can determine the IF/SJR of their journal of interest by checking its Impact Factor (typically on the journal web page) and its SCImago Journal Rank (here). As a test of this approach, I compared the following publishing groups that were expected to fit across the spectrum of legitimate publishers to predatory publishers:
It is noteworthy that BioMed Central (BMC) follows the same for-profit Open Access mega publisher model as MDPI, Frontiers, and Bentham Open, but has received almost no attention (to my knowledge) as a possible predatory publisher. BMC does not have particular association with predatory behaviours like spamming scientists with special issue invitations, or a history of controversial articles (that I'm aware of). In this sense, I am discussing BMC here almost as a reference point for the Open Access mega publisher business model. I will also note that Bentham Open has already been dropped by SCImago as a legitimate publisher, and so the SJR values I used come from the last available Bentham SJR data, typically around 2016-2017. I further pulled the Impact Factor metrics directly from each journal's home pages, which advertises IF from Journal Citation Reports' Clarivate analysis (see here). A cursory check validated that the IFs reported by PLoS, BMC, Frontiers, and MDPI generally reflected Impact Factors available on resurchify, academic accelerator and other aggregate sites. Results I analyzed the IF/SJR distribution of these various publishers using One-way ANOVA with Tukey's HSD (violin plots below). The distribution of IF/SJR tells an intuitive story: 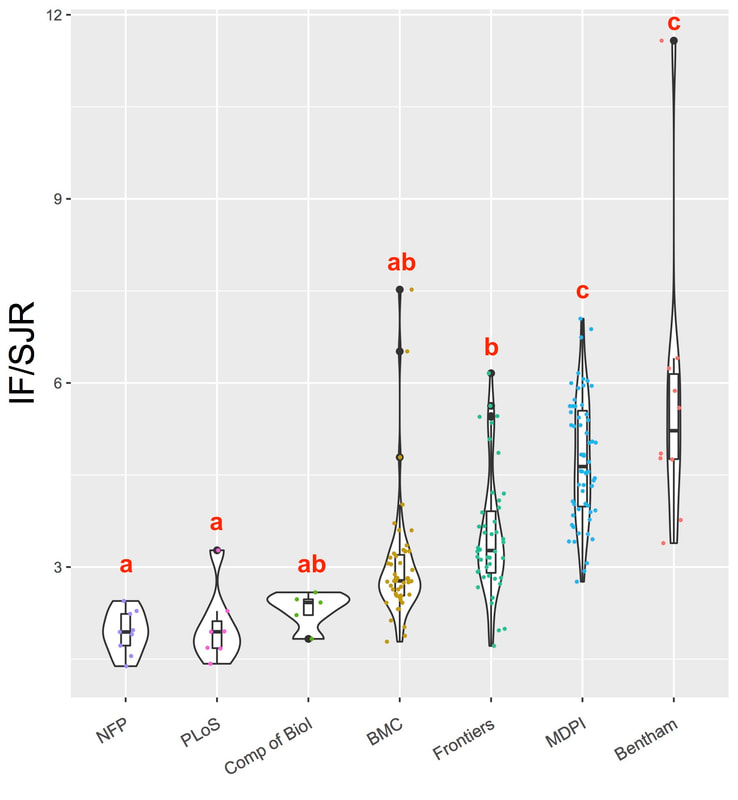 Ratio of Impact Factor (IF) to SCImago Journal Rank (SJR) for a variety of publishers expected to sort along the spectrum of legitimate scientific enterprise to predatory publisher. Red lettering above each plot indicates significant difference groups, where publishers with overlapping letters were not significantly different from each other (p-adjusted > .05). Internal boxplots show quartiles and 95% CI, and the black bar indicates the median. Bentham Open: clearly a predatory publisher A first clear indicator of Bentham Open as a predatory publisher was given by the fact that, when I went to their web page of "Journals Impacting Science," most Bentham journals advertised Impact Factors above any historical Impact Factor that journal had ever received. In other words, Bentham was advertising Impact Factors that: 1) did not match the genuine Impact Factor from recent metrics, 2) were always inflated, and 3) when cross-referenced with historical Impact Factors, they were not even arguable as "out of date." Accordingly, Bentham Open had the highest mean IF/SJR of all included Publishers. It should be noted that I only extracted data for the first 10 journals listed on the Bentham "Journals Impacting Science" page. My intention of including Bentham was as a positive control for a predatory publisher... Mission accomplished! MDPI and Bentham Open: not so different A second conspicuous observation from this analysis is the significantly higher IF/SJR that MDPI journals have compared to all other publishers. Indeed, the rate of Impact Factor Inflation (IF/SJR) for MDPI was only statistically similar to Bentham, a publisher with objectively predatory behaviours (MDPI:Bentham p-value = .123). This analysis supports the recent conclusions of Ref [1] that MDPI has crossed into the territory of a genuine predatory publisher, and both authors and legitimate academic databases should seek to cut all ties to MDPI. The curious cases of Frontiers Media and BMC A third notable observation was the performances of both Frontiers Media and BMC. Frontiers is infamous for stories where reviewers felt unable to reject a manuscript, instead being encouraged to judge the manuscript as needing major revisions thus trapping authors and reviewers in many cycles of peer review (ensuring revenue from article processing charges); this Twitter thread pops up on a fairly - regular - basis. However, these conversations are often accompanied by editors and reviewers that chime in to say "my experience was fine, if I'm honest," and Frontiers advertises that it has reasonable rejection rates (e.g. Frontiers in Marine Science rejection rate of 24%). The IF/SJR data here speak to some of the experiences shared in the scientific community. While a majority of Frontiers journals hover at or below a IF/SJR ratio of 3, a number are also high outliers that may indicate Impact Factor inflation. It should be noted that a few outliers are to be expected, particularly amongst larger datasets. For instance, comparing BMC to Company of Biologists is a bit unfair, as the total journals analyzed in the BMC pool outnumbers the entirety of Not for profits, PLoS, and Company of Biologists combined. BMC has four major outliers (IF/SJR: BMC Chemistry = 7.52; BMC Molecular and Cell Biology = 6.51; BMC Complementary Medicine Therapies = 4.79; and BMC Pharmacology and Toxicology = 4.02). However in this regard, Frontiers includes ten journals with a ratio above 4, despite hosting fewer total journals than BMC. As mentioned, I included Bentham in the analysis effectively as a "positive control" predatory publisher. However including Bentham in the analysis forces many additional comparisons, which reduces the power of the analysis to distinguish finer differences. Moreover, the small number of journals in PLoS (seven) and Company of Biologists (five) make it difficult to say much about them statistically as publishers. Therefore I re-ran the analysis excluding Bentham, and uniting PLoS and Company of Biologists as one group (below): 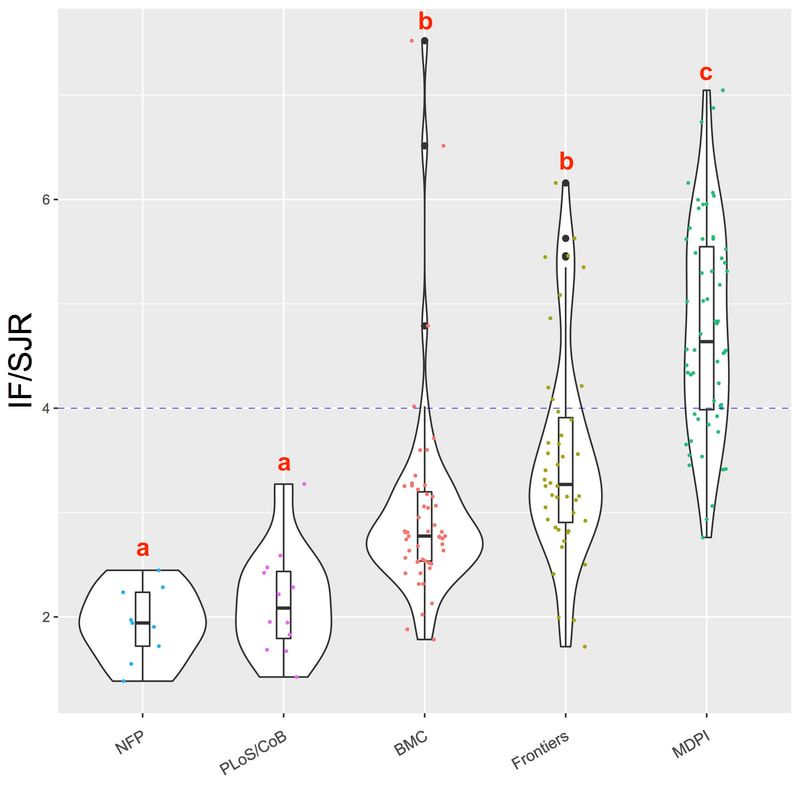 Repeat of the earlier analysis, excluding Bentham from the One-way ANOVA and multiple comparisons, and unifying PLoS and Company of Biologists (CoB). Notably, this improves the normality of the data, reflected by a Shapiro-Wilk p-value two orders of magnitude higher than before (though overall the dataset still greatly violates normality). Internal boxplots show quartiles and 95% CI, and the black bar indicates the median. The lower quartile of MDPI ≈ 4 is indicated using a blue dashed line. A focus on BMC and Frontiers Media Removing Bentham and unifying PLoS and CoB neatly delineated publisher groups. Notably, BMC has a higher IF/SJR compared to the list of not-for-profit publishers (NFP:BMC p-value = .018), and PLoS/CoB (PLoS/CoB:BMC p-value = .042). This is still many orders of magnitude different from the same comparisons using Frontiers (NFP:Frontiers p-value = 1e-4 and PLoS/CoB:Frontiers p-value = 2e-4), but notable as BMC and Frontiers were not significantly different (BMC:Frontiers p-value = .072). In no way am I suggesting BMC practices are overall problematic, and I will state that my overall impression of BMC is reasonably positive. My intention of including BMC was to provide a benchmark for what a reputable Open Access mega publisher looks like, given the massive number of journals they host under one umbrella. Thus it's notable that BMC appears to be statistically distinct from not-for-profit publishers, but only marginally so from Frontiers Media (a publisher with a record of occasionally sketchy behaviour). It should be noted that some Frontiers journals reach ratios similar to those of the not-for-profit publishers, including two of Frontiers' flagship journals "Frontiers in Immunology" and "Frontiers in Cell and Developmental Biology" (IF:SJR = 2.86 and 2.73 respectively), similar to the median of BMC journals (2.78). It seems like Frontiers is in a distinct space compared to the likes of MDPI (Frontiers:MDPI p-value < 1e-7) . Moreover, while some Frontiers journals are in sketchy territory in terms of Impact Factor inflation, Frontiers as a whole remains at least comparable to BMC. Nevertheless 23% (10 out of 44) of Frontiers Media journals have IF/SJR ratios >4, suggesting some Frontiers publications may already be on the same path as MDPI. Also, it's not like BMC:Frontiers having a p-value of 0.07 is the same as no noticeable difference either: the conclusion there is that there is a 93% likelihood that those two publishers have statistically dissimilar citation practices given the current evidence. I'd pay close attention to Frontiers journals with inflated IF/SJR moving forward. It is also noteworthy that the top 5 Frontiers journals by IF round out with IF/SJR ratios of: 2.86, 2.73, 5.35, 3.40, and 3.54. So at least Frontiers in Nutrition (IF = 6.58, SJR = 1.23, IF/SJR = 5.35) is on the disconcertingly high end of IF/SJR. In summary: at the time of writing (August 2021), both BMC and especially Frontiers Media have statistically distinct IF/SJR ratios compared to various not-for-profit journals and the journals from PLoS and Company of Biologists (p < .05). BMC and Frontiers Media are also marginally different from each other (p = .07) in terms of IF/SJR, but not significantly so. Conclusion This analysis of Impact Factor inflation by virtue of IF/SJR ratios supports recent commentaries that MDPI is acting in a manner associated with predatory publishing [1]. I additionally suggest that, for the time being, Frontiers Media is not significantly different from another Open Access mega-publisher: BioMed Central. However both BMC (slightly) and Frontiers (especially) deviate from respected society journals and other not-for-profit publishers in terms of Impact Factor inflation. This may speak to some extent on the virtue of the Open Access mega publisher model, but far more nuanced discussion is required to say anything meaningful about this difference. I also do not intend to insert an opinion here about whether one should or should not publish with any of these companies (well... except MDPI and Bentham). The IF/SJR metric is an objective ratio, but it likely has its limits in terms of relevance. I'll freely admit that I don't fully understand the inner workings of the SJR metric, and so I cannot properly describe how much of the IF/SJR ratio is based on circular logic. However, the fact that reputable not-for-profit publishers have a very distinct IF/SJR ratio compared to MDPI and a known predatory publisher (Bentham Open) is reassuring. The metric is clearly sufficient to distinguish this level of difference in scientific misconduct. My intention with this blog post is to help both myself and others come to their own decision about whether they should offer their manuscripts or services in support of these publishers. At this point dear reader, I will also remind you that one can conclude anything one wants to about these publishers, and I think that relies on many other factors that I have not discussed here. At the end of the day, I am providing this analysis to supplement discussion of predatory publishing, not as if it is the sole arbiter of predatory behaviour. Here I have used the ratio of Impact Factor to SCImago Journal Rank (IF/SJR) to expose journals guilty of Impact Factor inflation. This metric suggests MDPI is indeed practicing predatory behaviour, comparable to Bentham Open (a flagrantly predatory publishing group). The IF/SJR ratio of reputable not-for-profit publishing groups is reliably between 2-3. I wouldn't go so far as saying an IF/SJR > 3 is evidence of Impact Factor Inflation. PLoS One has an IF/SJR = 3.27, which indicates that without malicious intent on behalf of the publisher, the IF/SJR of individual journals can climb above 3; one could even argue that "14% of PLoS Journals have IF/SJR > 3." For this reason, I've arbitrarily used the quartile distributions for setting my cutoffs. Using MDPI as a benchmark predatory publisher, I would suggest that an IF/SJR >4 is the point at which a journal should be suspected of artificial Impact Factor Inflation (i.e. predatory behaviour). By introducing the metric of IF/SJR, I hope I have also introduced an easily-employed tool that can help distinguish if a publisher is involved in some shady practices. While sites like Think. Check. Submit exist, this requires constant updating and is ultimately based on subjective judgement calls. By contrast, the IF/SJR ratio is a concrete and continuous variable that can be calculated easily. This ratio can complement other online tools, like DAFNEE, which is a database of "290 non-profit, learned society, or university-associated journals relevant to the field of ecology and evolutionary biology." To ensure the integrity of scientific publishing, it is essential that scientists protect themselves and the community from the siren call of predatory publishing, and that predatory publishing behaviour is readily identified and quickly punished. References
The source data file and R script can be downloaded in the linked file below:
And for simplicity's sake, here is a tab-delimited table so you can directly copy/search this web page. Three numbers are included (IF, SJR, and IF/SJR):
Publisher Journal IF SJR IF_SJR Bentham Current Alzheimer Research 3.498 1.032 3.39 Bentham Current Bioinformatics 3.543 0.306 11.58 Bentham Current Drug Metabolism 3.731 0.667 5.59 Bentham Current Stem Cell Research & Therapy 3.828 0.802 4.77 Bentham Mini-Reviews in Medicinal Chemistry 3.862 0.603 6.40 Bentham Recent Patents on Anti-Cancer Drug Discovery 4.169 0.71 5.87 Bentham CNS & Neurological Disorders - Drug Targets 4.388 0.923 4.75 Bentham Current Gene Therapy 4.391 0.704 6.24 Bentham Journal of Microbial & Biochemical Technology 4.53 0.934 4.85 Bentham Current Neuropharmacology 7.363 1.955 3.77 BMC BMC Medical Imaging 1.93 0.54 3.60 BMC "BMC Sports Science, Medicine and Rehabilitation" 1.93 0.73 2.63 BMC BMC Developmental Biology 1.98 1.11 1.78 BMC BMC Surgery 2.10 0.65 3.26 BMC BMC Emergency Medicine 2.12 0.77 2.77 BMC BMC Pediatrics 2.13 0.81 2.64 BMC BMC Ophthalmology 2.21 0.88 2.52 BMC BMC Anesthesiology 2.22 0.70 3.15 BMC BMC Urology 2.26 0.68 3.35 BMC BMC Nursing 2.28 0.91 2.51 BMC BMC Cardiovascular Disorders 2.30 0.82 2.81 BMC BMC Musculoskeletal Disorders 2.36 0.84 2.82 BMC BMC Nephrology 2.39 0.85 2.82 BMC BMC Medical Education 2.46 0.81 3.04 BMC BMC Neurology 2.47 0.86 2.88 BMC BMC Pharmacology and Toxicology 2.48 0.62 4.02 BMC BMC Family Practice 2.50 1.08 2.32 BMC BMC Biotechnology 2.56 0.84 3.07 BMC BMC Chemistry 2.61 0.35 7.52 BMC BMC Medical Ethics 2.65 1.08 2.47 BMC BMC Health Services Research 2.66 1.10 2.42 BMC BMC Veterinary Research 2.74 0.85 3.22 BMC BMC Oral Health 2.76 0.87 3.18 BMC BMC Endocrine Disorders 2.76 0.74 3.71 BMC BMC Zoology 2.77 1.01 2.74 BMC BMC Medical Informatics and Decision Making 2.80 0.78 3.60 BMC BMC Genomic Data 2.80 1.01 2.77 BMC BMC Women's Health 2.81 1.02 2.76 BMC BMC Pregnancy and Childbirth 3.01 1.30 2.31 BMC BMC Medical Genomics 3.06 1.11 2.75 BMC BMC Gastroenterology 3.07 0.94 3.28 BMC BMC Infectious Diseases 3.09 1.28 2.42 BMC BMC Bioinformatics 3.17 1.57 2.02 BMC BMC Palliative Care 3.23 1.15 2.81 BMC BMC Ecology and Evolution 3.26 1.53 2.13 BMC BMC Neuroscience 3.29 1.17 2.82 BMC BMC Public Health 3.30 1.23 2.68 BMC BMC Pulmonary Medicine 3.32 1.23 2.70 BMC BMC Microbiology 3.61 1.11 3.25 BMC BMC Immunology 3.62 1.22 2.95 BMC BMC Psychiatry 3.63 1.44 2.53 BMC BMC Complementary Medicine and Therapies 3.66 0.76 4.79 BMC BMC Geriatrics 3.92 1.41 2.77 BMC BMC Genomics 3.97 1.55 2.57 BMC BMC Plant Biology 4.22 1.38 3.06 BMC BMC Molecular and Cell Biology 4.24 0.65 6.51 BMC BMC Cancer 4.43 1.36 3.26 BMC BMC Medical Research Methodology 4.62 1.82 2.54 BMC BMC Biology 7.43 3.95 1.88 BMC BMC Medicine 8.78 3.46 2.53 BMC BMC Molecular Neurodgeneration 14.20 5.57 2.55 Comp of Biol Biology Open 2.42 0.94 2.59 Comp of Biol Journal of experimental biology 3.31 1.37 2.42 Comp of Biol Journal of Cell Science 5.29 2.38 2.22 Comp of Biol Disease Models and Mechanisms 5.76 2.33 2.47 Comp of Biol Development 6.87 3.75 1.83 Frontiers Frontiers in Computational Neuroscience 2.38 0.79 3.00 Frontiers Frontiers in Neurorobotics 2.65 0.67 3.97 Frontiers Frontiers in Surgery 2.72 0.48 5.63 Frontiers Frontiers in Integrative Neuroscience 2.76 1.04 2.67 Frontiers Frontiers in Psychology 2.99 0.95 3.16 Frontiers Frontiers in Human Neuroscience 3.17 1.13 2.81 Frontiers Frontiers in Systems Neuroscience 3.29 1.65 1.99 Frontiers Frontiers in Veterinary Science 3.41 0.88 3.89 Frontiers Frontiers in Pediatrics 3.42 0.96 3.56 Frontiers Frontiers in Neural Circuits 3.49 2.04 1.72 Frontiers Frontiers in Earth Science 3.50 0.57 6.16 Frontiers Frontiers in Materials 3.52 0.72 4.86 Frontiers Frontiers in Behavioral Neuroscience 3.56 1.26 2.82 Frontiers Frontiers in Physics 3.56 0.85 4.21 Frontiers Frontiers in Public Health 3.71 0.91 4.08 Frontiers Frontiers in Neuroanatomy 3.86 1.96 1.97 Frontiers Frontiers in Neurology 4.00 1.23 3.25 Frontiers Frontiers in Energy Research 4.01 0.73 5.46 Frontiers Frontiers in Neuroinformatics 4.08 1.14 3.57 Frontiers Frontiers in Psychiatry 4.16 1.36 3.05 Frontiers Frontiers in Ecology and Evolution 4.17 1.32 3.17 Frontiers Frontiers in Synaptic Neuroscience 4.51 1.87 2.41 Frontiers Frontiers in Physiology 4.57 1.32 3.46 Frontiers Frontiers in Environmental Science 4.58 1.23 3.74 Frontiers Frontiers in Genetics 4.60 1.41 3.25 Frontiers Frontiers in Neuroscience 4.68 1.50 3.12 Frontiers Frontiers in Marine Science 4.91 1.56 3.15 Frontiers Frontiers in Medicine 5.09 1.39 3.67 Frontiers Frontiers in Chemistry 5.22 1.03 5.08 Frontiers Frontiers in Molecular Biosciences 5.25 2.10 2.50 Frontiers Frontiers in Cellular and Infection Microbiology 5.29 1.81 2.92 Frontiers Frontiers in Cellular Neuroscience 5.51 1.88 2.93 Frontiers Frontiers in Endocrinology 5.56 1.52 3.66 Frontiers Frontiers in Molecular Neuroscience 5.64 1.99 2.84 Frontiers Frontiers in Microbiology 5.64 1.70 3.32 Frontiers Frontiers in Aging Neuroscience 5.75 1.83 3.15 Frontiers Frontiers in Plant Science 5.75 1.75 3.28 Frontiers Frontiers in Pharmacology 5.81 1.38 4.20 Frontiers Frontiers in Bioengineering and Biotechnology 5.89 1.08 5.45 Frontiers Frontiers in Cardiovascular Medicine 6.05 1.71 3.54 Frontiers Frontiers in Oncology 6.24 1.83 3.40 Frontiers Frontiers in Nutrition 6.58 1.23 5.35 Frontiers Frontiers in Cell and Developmental Biology 6.68 2.45 2.73 Frontiers Frontiers in Immunology 7.56 2.65 2.86 MDPI Diversity 2.47 0.70 3.54 MDPI Entropy 2.52 0.47 5.39 MDPI Crystals 2.59 0.54 4.81 MDPI Forests 2.63 0.68 3.89 MDPI Minerals 2.64 0.52 5.05 MDPI Buildings * 2.65 0.58 4.56 MDPI Photonics 2.68 0.67 4.00 MDPI Applied Sciences 2.68 0.44 6.16 MDPI Atmosphere 2.69 0.70 3.84 MDPI Symmetry 2.71 0.39 7.05 MDPI Animals 2.75 0.58 4.71 MDPI Insects 2.77 0.80 3.45 MDPI Separations 2.78 0.49 5.73 MDPI Processes 2.85 0.41 6.88 MDPI Coatings 2.88 0.48 5.95 MDPI Micromachines 2.89 0.58 5.03 MDPI ISPRS International Journal of Geo-Information 2.90 0.68 4.24 MDPI Agriculture 2.93 0.53 5.49 MDPI Energies 3.00 0.60 5.02 MDPI Water 3.10 0.72 4.32 MDPI Sustainability 3.25 0.61 5.31 MDPI International Journal of Environmental Research and Public Health 3.39 0.75 4.54 MDPI Brain Sciences 3.39 0.92 3.69 MDPI Land 3.40 0.74 4.56 MDPI Chemosensors 3.40 0.63 5.44 MDPI Agronomy 3.42 0.71 4.83 MDPI Pathogens 3.49 0.98 3.55 MDPI Sensors 3.58 0.64 5.62 MDPI Materials 3.62 0.68 5.31 MDPI Diagnostics 3.71 0.62 5.96 MDPI Life 3.82 0.97 3.92 MDPI Plants 3.94 0.89 4.41 MDPI Fermentation * 3.98 0.87 4.55 MDPI Genes 4.10 1.34 3.06 MDPI Membranes 4.11 0.61 6.74 MDPI Toxics 4.15 0.78 5.30 MDPI Catalysts 4.15 0.80 5.18 MDPI Polymers 4.33 0.77 5.62 MDPI Foods 4.35 0.77 5.62 MDPI Molecules 4.41 0.78 5.64 MDPI Vaccines 4.42 1.30 3.41 MDPI Toxins 4.55 1.05 4.34 MDPI Antibiotics 4.64 0.96 4.83 MDPI Remote Sensing 4.85 1.29 3.77 MDPI Biomolecules 4.88 1.13 4.34 MDPI Metabolites 4.93 1.11 4.45 MDPI Journal of Personalized Medicine 4.95 1.25 3.94 MDPI Viruses 5.05 1.83 2.76 MDPI Nanomaterials 5.08 0.92 5.52 MDPI Biology 5.08 1.73 2.93 MDPI Marine Drugs 5.12 0.85 6.04 MDPI Biosensors 5.52 0.91 6.06 MDPI Nutrients 5.72 1.42 4.03 MDPI Journal of Fungi 5.82 1.70 3.42 MDPI Pharmaceuticals 5.86 1.30 4.53 MDPI International Journal of Molecular Sciences 5.92 1.46 4.07 MDPI Biomedicines 6.08 1.51 4.02 MDPI Antioxidants 6.31 1.07 5.92 MDPI Pharmaceutics 6.32 1.05 6.00 MDPI Cancers 6.64 1.82 3.65 NFP Journal of Evolutionary Biology 2.54 1.29 1.97 NFP Evolution 3.57 1.84 1.94 NFP Journal of Virology 4.50 2.62 1.72 NFP Proc. R Soc B 5.35 2.34 2.28 NFP mBio 6.78 3.56 1.90 NFP eLife 8.14 5.88 1.38 NFP PNAS 11.21 5.01 2.24 NFP EMBO Journal 11.60 7.48 1.55 NFP MBE 16.24 6.64 2.45 PLoS PLoS One 3.24 0.99 3.27 PLoS PLoS Neglected Tropical Diseases 3.89 1.99 1.95 PLoS PLoS Computational Biology 4.43 2.63 1.68 PLoS PLoS Genetics 5.11 3.59 1.42 PLoS PLoS Pathogens 6.22 3.72 1.67 PLoS PLoS Biology 8.03 4.13 1.95 PLoS PLoS Medicine 11.07 4.85 2.28 Comments are closed.
|
AuthorMark Archives
March 2024
Categories |
||
 RSS Feed
